First published in FLEXO Magazine, June 2018 issue.
Written by Harper Western Regional Sales & Technical Manager, Greg Horney
Widely respected management consultant Peter Drucker is often quoted as saying, “You can’t manage what you don’t measure.” You can use whatever version of this you like, such as, “You can’t improve what you don’t measure.” The idea is ensuring you are measuring the elements that impact your bottom line. These are your key performance indicators or KPIs.
Monitoring your KPIs is an essential part of production management and continuous improvement. These KPIs should have a direct tie to the bottom line if they are going to mean anything. Often, these KPIs are individually monitored, and include categories such as waste, run time, downtime or makeready. Improvements in any of these categories can be presented with false savings or “funny money” because of the effect on other categories. Each KPI should include one or more consequential metric to ensure that if one shows improvement, it does not adversely affect another.
Taking a hypothetical example, we have a 17-in. press and we are monitoring the makeready times on jobs of similar length for all 8-color presses over the period of a month (depicted in Chart 1). The team launches a project for makeready reduction with a goal of 20 percent. After the month passes, the team reports makereadies have improved by 25 percent.
On its own merits, it looks like a great improvement. However, if team members would have measured a consequential metric, they would have spotted that downtime was increased when the solutions used for faster makeready times were applied. The team would have realized the need to go back and find other means to reduce makeready without adversely affecting downtime.
OEE, from a continuous improvement “ point, helps managers set goals that target three main measurements: availability, performance and quality.
ORGANIZING DATA
Overall equipment effectiveness (OEE) is a tool used to evaluate how well a manufacturing process is functioning. The idea of OEE is not a new one—it came about back in the 1960s, pioneered by Seiichi Nakajima. Seiichi based OEE off of Harrington Emerson’s idealisms on labor efficiency.
OEE calculates in a manner that allows you to see how a particular machine, shift or shop performed while keeping consequential criteria in the data. OEE, from a continuous improvement point, helps managers set goals that target three main measurements: availability, performance and quality.
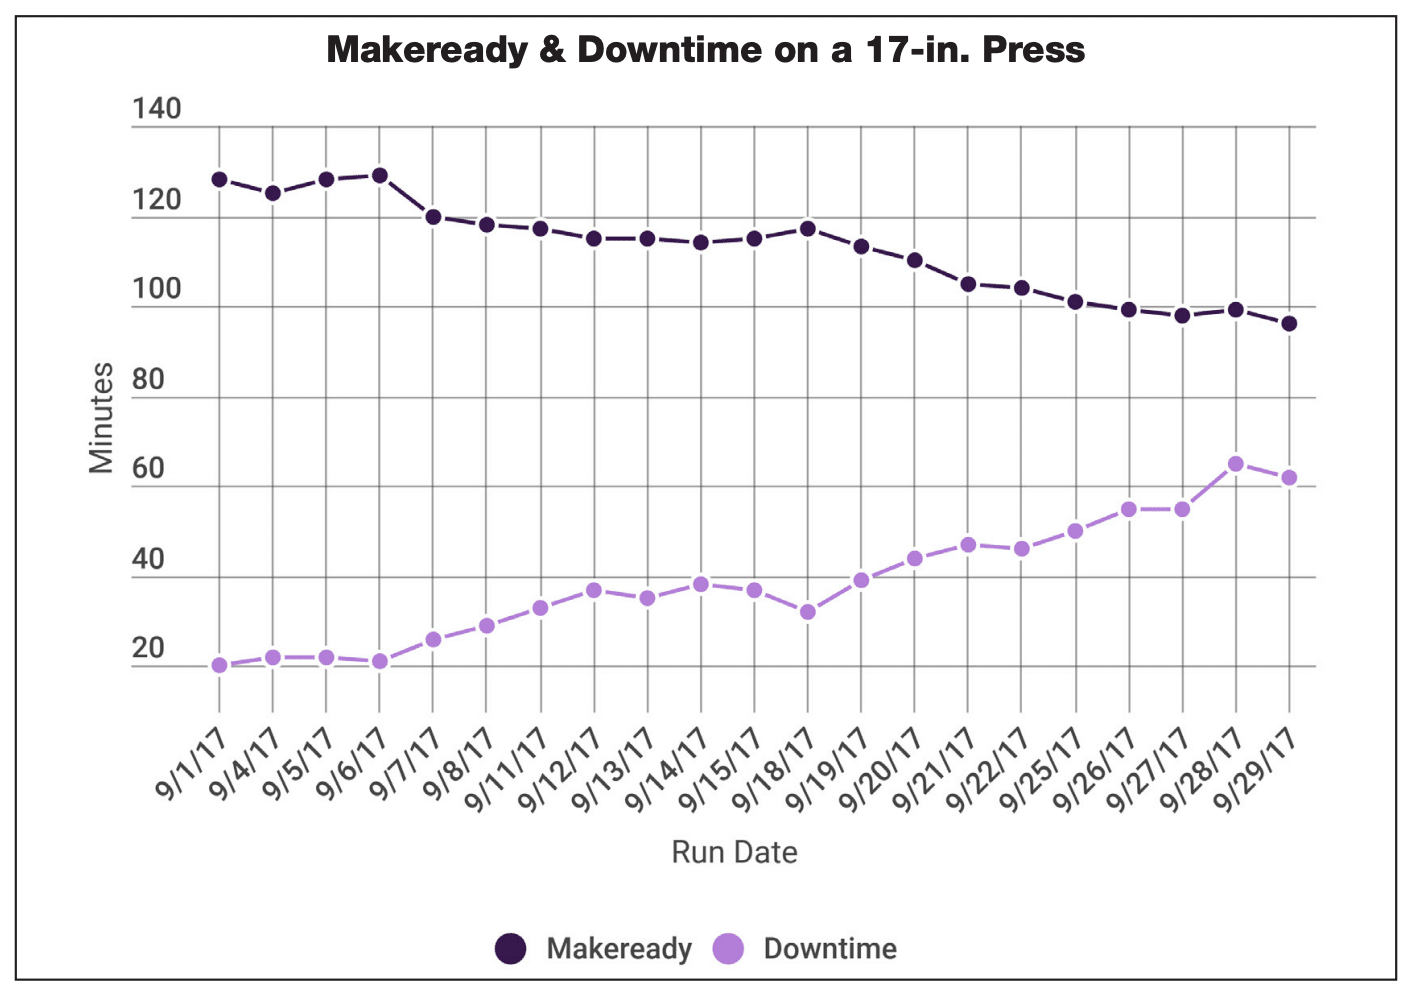
Chart 1 All data courtesy of Harper Corporation of America
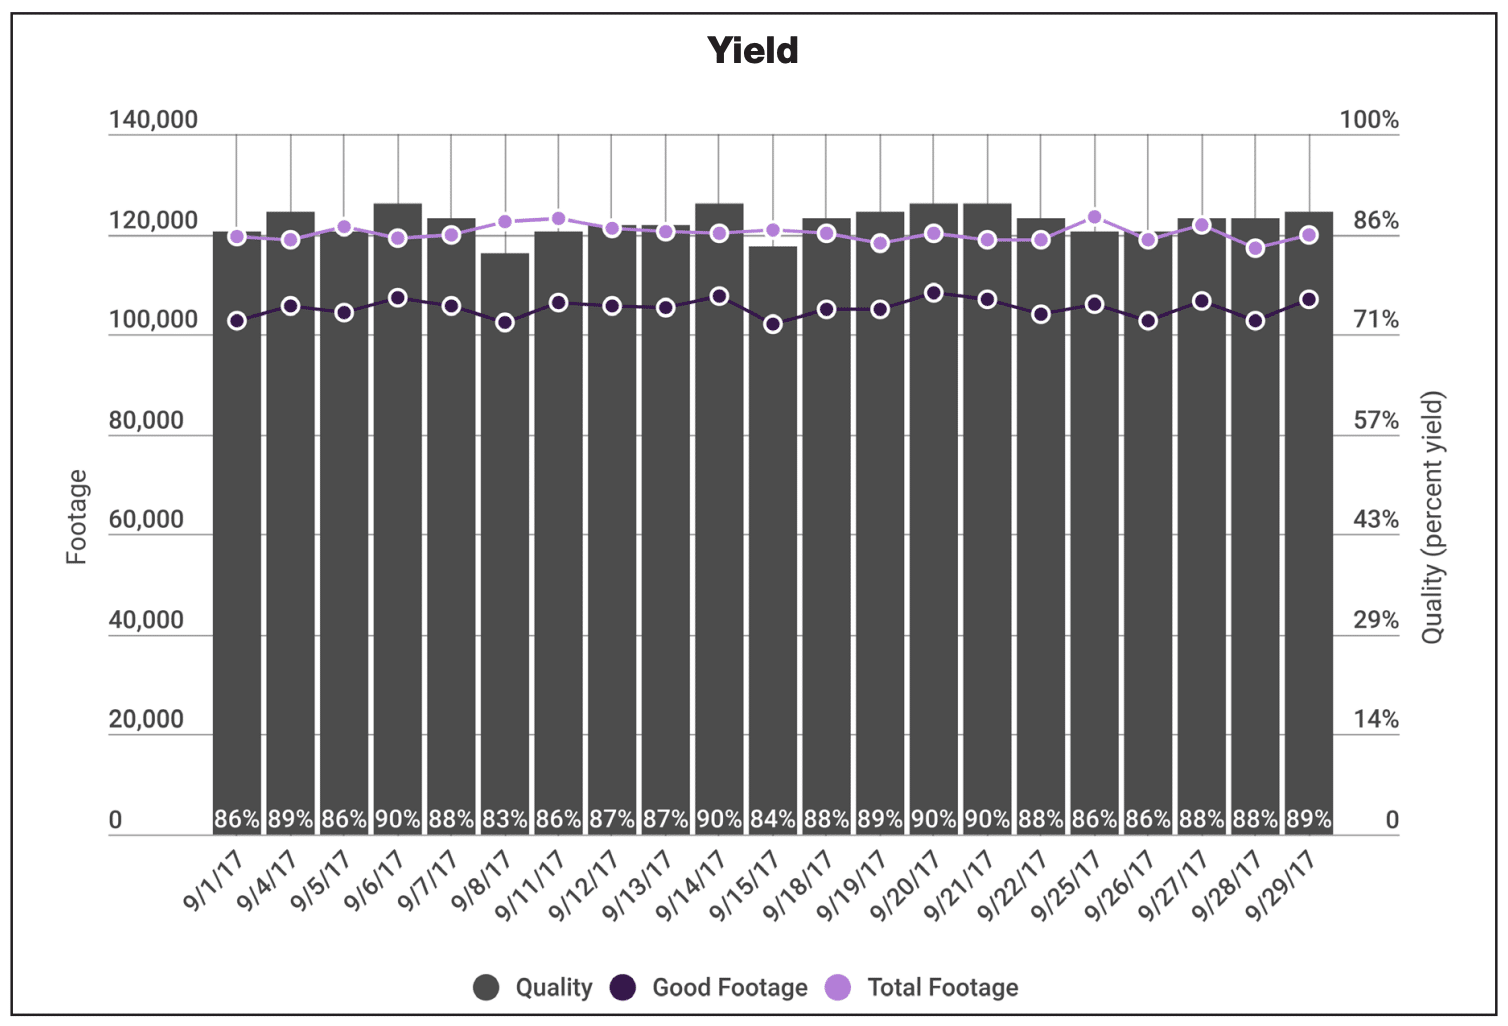
Chart 2
The intention of OEE is not to replace your current KPIs, but more to organize the data that is already being collected. When a drop in OEE is recognized, getting to the root cause is, in most cases, easily traceable through which multiplier dropped. Each of these measurements utilizes two indicators that can be broken down into smaller buckets for analysis.
As we go through OEE here, understand this is a 10,000-ft. view. There is a lot here that can go much deeper. There are versions of OEE that break down to OEE1, OEE2 and even OEE3; this discussion will only skim the surface.
Monitoring your key performance “ indicators is an essential part of production management and continuous improvement.
Just like any KPI, both the data collected and how it is measured is completely yours and your interpretation of what should or shouldn’t be measured, but it must include the six key losses of planned and unplanned stops, minor stops and slow takt time, and production and startup waste. One prime example is in the availability set, where one company may measure as availability accounting for 24 hours/day and 365 days/year, where another may feel availability only accounts for scheduled machine time which may include breaks and lunches if the press is not staffed during those periods.
The important thing, once you have determined how to measure the data, is to stay consistent.
OEE is derived from the following equation: OEE = Availability x Production x Quality. To break down OEE to its core, let’s look at each element
AVAILABILITY
Your availability is simply your run time divided by your planned production time, where your run time equals your planned production time minus your stop time. Within your availability multiplier, you have both planned and unplanned downtime.
Planned downtime includes things like makeready, matrix changes, roll changes, etc. Unplanned downtime, commonly attributed to machine failure, includes things like maintenance downtime (mechanical, electrical, etc.), unscheduled breaks or meetings, ink spills, color matching, and web breaks.
Each shift needs to record any downtime and makeready time. Unless the press is running every minute of the shift non-stop, those times will be recorded and identified as to why. This will include roll changes, ink adjustments and so forth. Stops that include web breaks, ink overflow/blowout, color matching, alarm stops and the like are counted as unplanned downtime. These examples should all be tracked as smaller buckets for deeper dives into their root causes or for continuous improvements.
Let’s look at an example of a shift:
Planned downtime = 120 minutes
• 3 roll changes/hour @ 5 minutes each = 15 minutes x 8 hours = 120 minutes
Unplanned downtime = 32 minutes
• 1 ink blowout @ 20-minute clean-up
• 1 web break @ 12 minutes

Chart 3
480 minutes/shift – 152 minutes total downtime ÷ 480 minutes/shift = 68.3 percent Availability for the shift
DEFINING DOWNTIME
It is critical to understand what downtime is. Downtime can be considered as anything that doesn’t make a physical change to the product. Using the letters in “downtime” as an acronym—as described by Taiichi Ohno, the father of the Toyota Production System—it is easy to sort downtimes. There are essentially eight types of waste:
• Defects include product that does not meet or exceed customer expectations, to include makeready and production waste
• Overproduction is the overrunning of a job that is not billable. Sometimes we overrun jobs because we know waste is high or to put into inventory. But you have to be careful, as both high waste and inventory are forms of waste if we do not have purchase orders (POs) or inventory agreements in place. It’s a calculated risk
• Waiting is poor takt time where one process is faster or slower than the next; where one process has to stop to wait to perform the next task
• Not utilizing employee skill or talent is not having the right people in the right place. This can show up in the form of poor training or not fully utilizing the talent of your staff
• Transport is the moving of materials from place to place. If you are having to move your material all the way across the plant to perform the next step in converting, you may want to look at improving your workflow
• Inventory can be both raw materials or finished goods. If we don’t have POs or agreements to purchase, carrying an inventory is a calculated risk, as graphics change and can render printed materials useless. Overpurchasing raw materials without solid forecasts is also a calculated risk. A customer may have always purchased a 1.5 mil white poly label, but now wants semi-gloss to reduce costs. If you loaded up on 1.5 white poly, you may be stuck with it for a while
• Motion is the waste of movement. If you have to walk all the way to the end of your press multiple times a day to get a flathead screwdriver, think about where you need that flathead all the time and put it where it is needed the most. Doing a good spaghetti diagram identifies motion waste pretty quickly
• Excess processing is usually caused by a lack of standards, excessive reports and human error. This can be the result of an overthought or poor process reacting to a previous defect
These wastes, like the OEE here, is covered at a very high level and can be broken down to finer detail.
Teams would track planned and unplanned downtime caused for continuous improvement projects to improve availability. Activities such as ink proofing using anilox correlation, 5S, lean manufacturing practices and robust maintenance programs will improve the availability element of OEE.
PERFORMANCE
The performance measurement in OEE looks at your “running to standard” by considering both idle and small stops as well as slow takt time as the key indicators for this multiplier. Taken from the German word for the baton an orchestra conductor uses to keep the time or the beat, takt time is just that—the measurable beat or pace of production.
Essentially, takt time is the manufacturing rate for a finished product to get to the customer. This can be both internal and external customers. For internal customers, it is the time it takes to finish a task to completion for the next process that physically changes the product. Transportation from one process to the next, sorting and waiting— these are not measured as takt time, but rather as a form of waste. For external customers, slow takt time results in late deliveries or long lead times.
Instances such as web breaks, blade changes and ink adjustment all count toward idle and small stops. Items like having to run slow due to ink or substrate performance, or registration issues, would account to run standard.
Typically, run standard is measured against the machine rate of the press, rewinder, laminator, etc. If a press machine rate is 700 fpm on the nameplate, that would be the standard of your OEE metric. There are ideal run rates or theoretical run rates that can be used as the standard. However, this would be a standard that company stakeholders would have to agree on, based on a long history or established machine burden rates, especially when those burden rates are based on ROI or asset value of that equipment.
Machine rate is the metric that frustrates machine operators the most, especially in narrow web operations. The leading reason is that machine rates are based on the mechanical capability of the press while not taking into account the many different types of converting done inline, such as die cutting, de-lam/re-lam or cold/hot foil. Machine rates should not be changed to reflect downstream converting unless the downstream operation has an identified mechanical capability associated with it. Then you can take the lesser of the two. An example would be a turret rewinder with a slower speed than the press. If the operation is not used all the time, take the higher of the capabilities. By not doing so, you can introduce bad information to the dataset. Taking the higher capability number will yield a lower OEE number; however, these are your baselines. The rule of “it is what it is” applies.
With any equipment, we all understand that breakdowns, such as web breaks, wrap-ups and ink spills happen along the way. Wouldn’t it be a perfect world if we could all run at the 100 percent rated speed of the press regardless of the job? These anomalies will be identified by using the results of OEE. Equipment, strategies and processes to reduce anomalies and enhance performance could include the following: 5S, press optimization, standardization, inline color management, vision systems, auto-register and maximizing roll length to reduce roll changes.
QUALITY
Simply put, quality is your yield, defined as good product divided by total product ran (see Chart 2). Almost every plant I’ve been in looks at waste and/or yield as a KPI measurement. If you are tracking good product, the difference in total product ran is your waste and if you’re tracking waste, your total product ran minus your waste is your good product. Essentially, it’s what went in versus what good came out.
Quality is a metric where the potential for “creative math” may come into play on production floors, with methods such as understating waste, shorting total product ran or claiming roll footage deviation. Utilizing OEE, you avoid any “fudging” of the numbers to improve without skewing the availability and performance elements to make the math work. Of course, you must always validate your numbers because at the end of the month during inventory, it all gets hashed out and that creative math gets caught.
With quality comes consistency and repeatability. Ways to improve quality metrics include adopting Flexographic Image Reproduction Specifications & Tolerances (FIRST), inline vision systems, auto-register systems and establishing standard operating procedures (SOPs).
When we look at our OEE numbers from a high level (as in Chart 3), we can see our three measurements of availability, performance and quality, along with our final OEE number. It’s easy to see areas that need improvement or may have shown dips that affect your OEE percentage. Often, we know what may have happened, be it bad film, ink, dirty anilox or any other combination of issues that happen in manufacturing. The idea is to understand and see those issues and make efforts to reduce those occurrences to drive the OEE trend upward.
When establishing OEE baselines, often operators, managers and business stakeholders are taken aback initially by the numbers. Especially in the flexo industry, OEE is often a low percentage and a large pill to swallow as stakeholders come to grips with the issues that have arisen. We know that if these issues are left to grow unchecked, they become the bogeys of performance improvement efforts.
Once you understand that the numbers are not a personal judgment, but rather a baseline from which to improve processes, OEE becomes a much more effective tool. It’s really understanding numbers that go into the calculations and why they are what they are.
Overall equipment effectiveness is a way to evaluate how well a manufacturing process is utilized. The three major categories of availability, measuring both planned and unplanned downtime, production measuring both idling/small stops and slow takt time, and quality measuring both production rejects and makeready/startup waste, all make up your six big losses and goal for measuring OEE. OEE gives the opportunity to address the little things that plague us daily and make the manufacturing process as productive as possible. It also allows you to prioritize improvement efforts by evaluating what is happening on the production floor, like downtime wastes, run speeds or capacity
 About the Author: Greg Horney has more than 30 years of experience in flexographic and offset printing. He has a BS in applied arts and sciences from Rochester Institute of Technology. Greg has worked from the ground up in the printing industry where his experience ranges from gopher and pressman to graphics and prepress, quality, continuous improvement/project management, print management and production management.
Greg is a Lean Six Sigma Black Belt and is also FIRST Implementation Specialist Certified. He both chaired and co-chaired sessions at FTA events, most recently chairing the “Pressroom Pressures” session at Forum 2017 and speaking on a panel at Fall Conference 2016. Greg has participated as a judge in the Excellence in Flexography Awards on three occasions and has published articles in FLEXO Magazine. Greg is now applying his years of industry experience to helping Harper Corporation of America and the Harper Graphic Solution Group’s customers as a technical service representative in the Central Plains and Southwest regions.
To view the original FLEXO Magazine article click HERE.


